Excel is a powerful tool for data management, offering a versatile platform for organizing, analyzing, and presenting information. A key feature of Excel is its use of rows and columns, which are the building blocks of any spreadsheet. Knowing how to utilize these components effectively is essential for efficient data handling. This guide explores the significance and practical use of rows and columns in Excel.
Understanding Rows and Columns
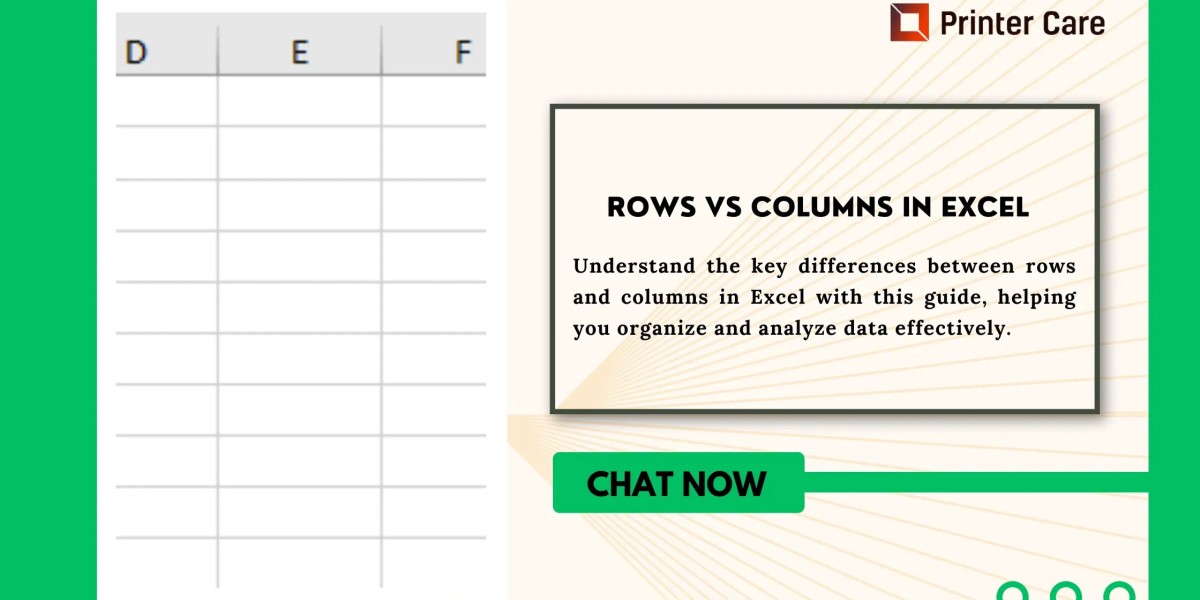
In an Excel spreadsheet, **rows** are horizontal lines labeled with numbers (1, 2, 3, etc.), while **columns** are vertical lines marked by letters (A, B, C, etc.). Each intersection of a row and a column forms a **cell**, which is identified by a combination of the column letter and row number, such as A1 or B3.
Purpose and Usage
Rows:
1. Data Records: Rows are commonly used to store individual records or entries. For instance, in a customer database, each row could contain a different customer's details, like name, contact information, and address.
2. Sequential Data: Rows are ideal for organizing sequential information, such as dates or times. In a financial report, for example, each row might represent a separate transaction date.
3. Grouping Information: Rows help group related data. For example, in a task management sheet, each row could represent a different task, with columns detailing the task description, responsible person, and status.
Columns:
1. Data Categories: Columns are used to categorize data, providing labels for the type of information each row contains. In a product inventory, columns might include "Product Name," "SKU," "Price," and "Quantity."
2. Data Analysis: Columns facilitate data analysis by allowing the use of functions like SUM or AVERAGE. For instance, you could sum all sales amounts in a column to determine total sales.
3. Data Filtering and Sorting: Columns make it easy to sort and filter data. For example, you can sort a list of items by price or filter a list to show only items that are in stock.
Managing Rows and Columns
Inserting and Deleting:
Inserting: To add a new row or column, right-click the row number or column letter where you want the insertion, and select "Insert." This action will shift existing data to accommodate the new row or column.
Deleting: To remove a row or column, right-click its number or letter and choose "Delete," which will eliminate the selected row or column and adjust the layout accordingly.
Resizing:
Adjusting Height and Width: You can resize rows and columns by dragging the borders between the row numbers or column letters. For precise adjustments, you can specify dimensions using the "Format" option under the Home tab.
Formatting and Organization
Formatting:
- Cell Formatting: Customize the appearance of cells with fonts, colors, borders, and alignment options to make data more visually appealing and easier to read.
Conditional Formatting: This feature applies specific formatting based on cell values. For example, you can highlight cells that contain numbers above a certain threshold or use color scales to represent data intensity.
Sorting and Filtering:
Sorting: Sort data in ascending or descending order based on column values to organize and analyze information.
Filtering: Use filters to display only rows that meet specific criteria, such as showing only sales above a certain amount or records from a particular date range.
Practical Applications
Budget Tracking: Use rows for each financial transaction and columns for details like date, description, and amount, which helps in analyzing financial status.
Project Management: Track project tasks with rows for each task and columns for status, assignee, and deadlines.
Inventory Management: Manage product inventory with rows representing products and columns for details like stock levels and supplier information.
Conclusion
Mastering the use of rows and columns in Excel is essential for efficient data organization and analysis. Rows help in listing and recording data, while columns categorize and describe this data. By understanding and leveraging these features, you can enhance your data management skills and create more effective spreadsheets. Whether you're managing budgets, projects, or inventories, effective use of rows and columns can significantly streamline your data processes and boost productivity.